
The Symphony Dashboard (portal.symphonydesk.io) provides a simple, fast, and secure interface for triggering automation runbooks, viewing job history, and monitoring connected runners. It is designed for IT teams who want an easy way to execute backend automations without using scripts or APIs directly.
🔐 Accessing the Dashboard
Each customer receives a dedicated, secured view of their automation environment.
When you log in, you will see your customer context displayed at the top of the page:
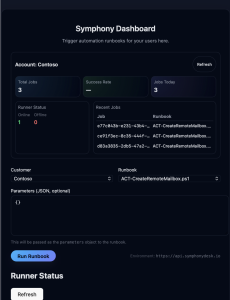
Account: Contoso
This ensures all runbooks and job history apply only to your environment.
📊 Dashboard Overview
The top section of the UI provides real-time statistics about your automation environment:
- Total Jobs — Number of jobs executed for the account.
- Success Rate — Percentage of jobs completed successfully.
- Jobs Today — Jobs triggered in the last 24 hours.
- Runner Status — Number of online/offline automation runners.
These metrics appear visually in the dashboard header for quick reference.
(See Symphony Dashboard, page 1.)
▶️ Running a New Job
To execute a new runbook:
1. Select Customer
Most organizations will have a single tenant.
Example: Contoso.
2. Select Runbook
Choose from your list of available runbooks.
Example:ACT-CreateRemoteMailbox.ps1
3. Provide Parameters (Optional)
Runbooks may accept JSON input:
{
  "UPN": "user@contoso.com"
}
The parameters are passed directly to the runbook’s execution environment.
This field supports full JSON objects.
4. Click “Run Runbook”
Press the Run Runbook button to trigger the job immediately.
A confirmation and polling indicator appear as the job is processed.
The Environment URL is displayed below the button for transparency:https://api.symphonydesk.io
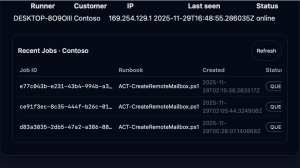
📡 Runner Status
The Runner Status panel shows all registered runners for your account, including:
- Runner hostname
- Customer
- IP address
- Last heartbeat
- Online/offline state
Example from page 2:DESKTOP-8O9OIII Contoso 169.254.129.1 online
If a runner is offline, runbook executions will queue until it reconnects.
📜 Recent Job History
The bottom section of the dashboard displays all recently executed jobs for your account.
Columns include:
- Job ID
- Runbook
- Created Timestamp
- Status (QUEUED, RUNNING, FAILED, COMPLETED)
Example entries (page 2):
e77c043b-e231-43b4…ce91f3ec-8c35-444f…d83a3835-2db5-47a2…
All are shown with the runbook name and timestamp.
You can refresh job history at any time using the Refresh button in the top-right corner of the panel.
⚠️ Error Handling
If a job fails, the dashboard displays detailed error output in the result panel, including:
- Error message
- Logs
- Raw response from the API
This helps teams quickly diagnose automation issues without digging into logs on runners or servers.
🛠 How This Connects to the API
The Symphony Dashboard UI is a visual layer on top of the same backend API developers can call directly.
For example:
Runbook execution uses the POST /jobs (or /jobs/execute) API — the UI simply wraps your input and sends it on your behalf.
Job polling uses GET /jobs/{job_id} until the job reaches a terminal state.
This makes the UI a perfect companion for teams who want automation without needing to write scripts.
🚀 Summary
The Symphony Dashboard gives IT teams a clean, intuitive, and powerful interface for:
- Triggering automation
- Monitoring runner availability
- Viewing job history
- Reviewing outputs and errors
- Interacting with the SymphonyDesk automation backend in real time
It removes the need for scripting, simplifies execution flow, and provides full visibility into your automation environment.